Transition Graph
Displays an interactive directed graph where nodes are unique events and edges represent transitions between them. Edge weights can show transition probabilities, counts, or time-based metrics. Supports diff mode to compare two user segments side by side.
How it works
Take every adjacent pair of events in every path and count the pairs (Path Analysis puts this next to the other summaries). Each distinct event becomes one node, no matter where in the path it occurred, and each pair becomes a weighted edge.
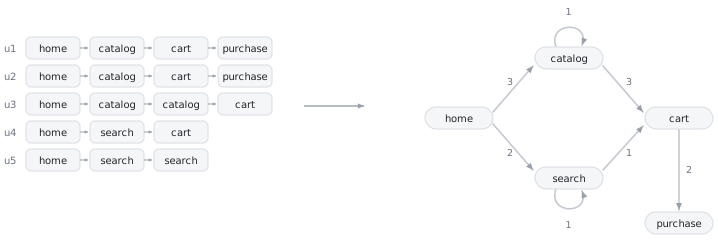
What this buys you, and what it costs:
- Loops become visible. An event repeating back to back turns into a self-loop, and a cycle between screens becomes an actual cycle on the graph. No step-based view shows this, and going in circles is one of the most common things real users do.
- The picture stays finite. One node per distinct event, however long the paths — so the graph works as a map of the product.
- Position is gone. A
cart → purchaseedge says the transition happened, not whether it happened on step 3 or step 30. When timing within the path is the question, use Step Matrix or Step Sankey instead.
The default edge weight, proba_out, is a conditional probability: of everything
that happens after the source event, what share goes to the target. Edges out
of a node therefore sum to 1, and the graph reads as a Markov-style map. Switch
to unique_paths or count when you care about volume rather than likelihood,
or to time_median to find the slow transitions — see
Edge weights below.
Edges are filtered before drawing (by default, each node's few strongest
outgoing edges), otherwise a real eventstream renders as a hairball. That filter
is a display choice — the underlying matrix always has every transition, and
transition_graph_data() returns it in full.
Usage
stream.transition_graph()
stream.transition_graph(edge_weight="count", diff=("user_lifecycle", "loyal", "new"))
stream.transition_graph(state_file="checkout_graph.json")
stream.transition_graph(path_pattern="add_to_cart->.*->purchase")
stream.transition_graph(
    views=[{"name": "Checkout", "focus": {"type": "node", "event": "cart"}}],
    view="Checkout",
)
Examples
Basic
stream.transition_graph()Edge weight
stream.transition_graph(edge_weight="unique_paths")Diff mode
stream.transition_graph(diff=["platform", "mobile", "desktop"])Views
stream.transition_graph(
  views=[
      {
          "name": "Cart",
          "focus": {"type": "node", "event": "cart"},
          "edgeFilter": {"mode": "topk", "k": 2}
      },
      {
          "name": "Checkout path",
          "focus": {
              "type": "path",
              "nodes": ["cart", "shipping_details", "payment_details", "purchase"]
          }
      },
      {
          "name": "Big picture",
          "edgeFilter": {"mode": "range", "range": [0.10, 1]},
          "eventCountFilter": [500, 7000]
      },
  ],
  view="Checkout path",
  sidebar_open=False
)
Ego view
stream.transition_graph(
  views=[
      {
          "name": "Cart",
          "focus": {"type": "node", "event": "cart"},
          "egoNode": "cart"
      },
  ],
  view="Cart"
)
Parameters
Data
Data parameters change the computed result. They are exactly the arguments of
the widget's headless twin stream.transition_graph_data() — see
headless mode below.
| Parameter | Type | Description |
|---|---|---|
edge_weight | {"proba_out", "proba_in", "count", "unique_paths", "share_of_total", "avg_per_path", "time_median", "time_q95"}, default "proba_out" | Value shown on edges. See the Edge Weights section for more details. |
diff | tuple or list, optional | Draws a comparative chart for a pair of segments; see Diff mode. (segment_col, value1, value2) or (path_ids1, path_ids2); value2 may be <REST>, meaning "every other value of segment_col". |
path_col | str, optional | Path ID column override; defaults to schema.path_col. |
path_pattern | str, optional | Restrict the graph to paths matching a "->"-separated event sequence: "add_to_cart->.*->purchase" is those two in that order with anything in between, "add_to_cart->[^support_chat]*->purchase" the same without support in between. Full syntax: Path Patterns. Unlike Step Matrix's parameter of the same name this only selects which paths are drawn — a graph has no step axis to centre. Everything the widget shows, event counts included, is computed from the restricted set. To cut the paths themselves down to the window the pattern describes, use truncate_paths. |
Display
Display parameters only affect how the widget is rendered.
| Parameter | Type | Description |
|---|---|---|
height | int, default 500 | Widget height in pixels. |
sidebar_open | bool, default True | Whether the sidebar starts open. |
views | list of dict, optional | Named visual presets rendered as pills above the graph. Each view is a dict with the keys name, focus, edgeFilter, eventCountFilter, hiddenEvents, viewport (all optional except name) and describes only how the graph is displayed — never the computed data. See the Views section for a detailed description of every key. |
view | dict or str, optional | View applied once after the graph is built: a view dict (name not required), or the name of an entry in views. See the Views section. |
state_file | str, optional | JSON file the widget state is bound to; see Saving widget state. |
Edge weights
"proba_out"— probability of the transition among all transitions out of the source event."proba_in"— probability of the transition among all transitions into the target event."count"— number of times the transition occurred."unique_paths"— number of distinct paths containing the transition."share_of_total"— share of this transition among all transitions in the eventstream."avg_per_path"— average number of occurrences per path."time_median"/"time_q95"— median / 95th-percentile time between the two events (in seconds).
Views
views is a list of named visual presets rendered as pills above the
graph; view applies one of them (or an inline preset) right after the graph
is built. A view describes only how the graph is displayed — focus,
filters, hidden events, viewport — never the computed data, so the same view
works identically in the live widget, in exported HTML (including the
#view=<base64url> URL fragment) and in MCP report tabs
([Tab:view=Name] links in the analysis text).
Applying a pill always starts from the Default state — views do not inherit each other's settings — and the Default pill returns exactly the state the widget had before the first view was applied. Any manual interaction (clicking a node, moving a filter) deselects the active pill.
| Key | Type | Description |
|---|---|---|
name | str | Pill label; also the handle for view="Name" and [Tab:view=Name] links. Required for pills, optional for inline view= presets. |
focus | dict, optional | Dim everything except the focused element(s): a node, an edge, or a path. See focus. |
edgeFilter | dict, optional | Edge filter override — the Auto/Manual control at the bottom right. See edgeFilter. |
eventCountFilter | [min, max], optional | Event-count (node) filter in absolute occurrence counts — the sidebar's Event Count slider. |
hiddenEvents | list of str, optional | Events hidden in this view. |
viewport | str or dict, optional | Camera control. See viewport. |
nodePositions | dict, optional | Exact node coordinates ({"event": {"x": …, "y": …}}) the view pins on apply. Rarely needed by hand: manual arrangements persist on their own (per-dataset) and travel with exports. |
egoNode | str, optional | Opens the Ego view modal for this event on apply. Independent of focus — a view can set both, or just this. Not captured by the Copy view link button (the modal covers the toolbar while it's open) — write it by hand. |
focus
{"type": "node", "event": "cart"}— focus one event: everything else dims and the viewport fits the node together with its neighborhood. One direction is shown at a time by default: outgoing transitions,"direction": "in"for incoming,"direction": "both"for both at once (no color code — direction is read off the existing arrowheads). In the widget, clicking a node shows its outgoing transitions; clicking that same node again cycles to incoming, then to both, then back to outgoing. Diff mode always shows both directions (red/blue).{"type": "edge", "source": "cart", "target": "checkout"}— focus one transition: the edge and its two nodes stay bright (the edge is shown even when the edge filter would hide it), the weight label is forced on, and the viewport fits the pair.{"type": "path", "nodes": ["main", "catalog", "cart"]}— highlight a route of two or more events: consecutive transitions are drawn as an amber dashed overlay (visible through the edge filter), weight labels appear along the route, and everything outside the route dims. Segments with no direct transition in the data are skipped.
Omitting focus means "no focus" — the view only applies filters and the
viewport.
edgeFilter
{"mode": "topk", "k": 3}— the Auto mode: keep each node'skstrongest outgoing edges (plus every node's single strongest incoming edge, so no node is left unconnected).{"mode": "range", "range": [0.05, 1]}— the Manual mode: a weight range normalized to 0..1. For probability weights the bounds are the probabilities themselves; for other weight types they are fractions of the largest weight on the graph.
viewport
"fit"— fit the whole graph."fit-focus"— fit the focused node/edge/path; this is the default wheneverfocusis present.{"zoom": 1.4, "pan": {"x": 350, "y": 220}}— an exact camera position.
The easiest way to author a view is the Copy view link toolbar button:
arrange the graph by hand and click it — the current state (including the
exact viewport) is copied as a JSON snippet for views=[...] in the live
widget, or as a shareable #view= URL in exported HTML. To author a path
view by mouse: click the route's first event, then Cmd/Ctrl+click the
following events in route order — after every click, the outgoing edges
of the route's last event stay lit, so the candidates for the next click are
always visible. Every Cmd/Ctrl+click appends, so repeated events build
loops and cycles (A→B→B, A→B→A→C); Cmd/Ctrl+double-click on the
route's last event removes it — a backspace-like undo. Then Copy view link serializes the selection as
{"type": "path", ...}. Note that transitions are directed: the route
follows the click order, and segments with no direct transition in the data
are skipped when the view is applied.
Route statistics
While a path of two or more events is selected in the live widget, a badge
at the top shows statistics for that exact route — how many paths contain
the sequence A→B→…→N as strict consecutive transitions (no other events
in between). The badge's metric selector offers: unique paths (and their
share of all paths), traversals (total occurrences; a path may traverse
a route several times), avg per path, median / p95 route time
(from the route's first to last event within one traversal), and
P(route) — the product of the route's P(next | source) transition
probabilities. The default metric follows the current edge weight.
Ego view
With a node focused, the Ego view toolbar button expands its
neighborhood into a modal mini-sankey: the event in the center, incoming
transitions on the left, outgoing on the right, sorted with ribbon
thickness proportional to the value. The sides answer the two ego
questions directly, independent of the edge weight selected on the graph:
the left side shows each source's share of the arrivals at the event
(proba_in), the right side each target's share of the exits from it
(proba_out) — both sides sum to 100%, and the tooltip carries the raw
transition counts. Unlike the graph, the same event can appear on both
sides, and a self-loop shows up on each (marked ↻). The view is not
limited by the edge filter — it always shows the strongest transitions of
the focused event (up to 12 per side). Clicking a neighbor re-centers the
view on it, so you can walk the graph one neighborhood at a time; Esc or
clicking outside closes the modal. In diff mode the ribbons instead show
the displayed diff values with the red/blue color code, and hovering one
shows the same per-group breakdown tooltip as a graph edge — both group
values and the diff between them.
Headless mode
stream.transition_graph_data()
Compute the transition matrix between events (headless): an
events x events DataFrame where cell [source, target] holds the selected
edge_weight for the source -> target transition. This is the data
behind the transition_graph widget.