Step Sankey
Flow diagram of what users are doing at each step of their path: block height is the share of paths on that event at that step (columns sum to 1, or to 0 in diff mode), and ribbons show how volume moves between two adjacent steps. Ribbons do not chain — paths arriving by different routes merge at every column.
Same numbers as Step Matrix, drawn as flows.
How it works
Step Sankey draws the same numbers as the Step Matrix: all paths stacked up, sliced by step, counted per event (see Path Analysis). Both widgets share one headless method — the difference is only in the rendering. A column of the matrix becomes a column of stacked blocks whose heights are those shares, and the ribbons between two columns show how volume moves from one step to the next.
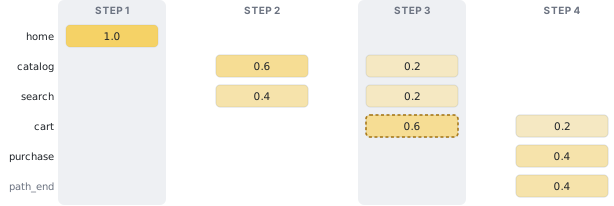
Reading it:
- Block height is a share of paths at that step; every column sums to 1 (to 0 in diff mode).
- A ribbon is a transition between two adjacent steps — how many paths that were on event A at step k are on event B at step k+1.
- Ribbons do not chain. Following three ribbons in a row does not give the
share of users who took that three-event route: at every column, paths arriving
by different routes merge into the same block. For an exact sequence use
path_pattern, thematches_patternpath metric, or the Transition Graph's route statistics badge.
Use the Sankey when the question is about volume flowing forward, and the matrix when you want to read one event across many steps or catch rare events that a thin ribbon would hide.
path_pattern re-anchors the diagram on an event, so that column 0 is always
that event and negative columns are what led up to it — see
anchoring for the full picture.
Usage
stream.step_sankey(max_steps=15, path_pattern="add_to_cart->.*->purchase")
stream.step_sankey(diff=("acquisition_channel", "paid_search", "<REST>"))
Examples
Basic
stream.step_sankey()Path pattern - central event
A single event as path_pattern re-centers the diagram on that event instead of
path_start: column 0 is always purchase, negative columns are the steps
leading up to it, positive columns are what follows.
stream.step_sankey(path_pattern="purchase")Path pattern - funnel patterns
Chaining several anchors with .* renders one diagram block per anchor, side by side,
so you can follow a multi-step funnel across blocks.
stream.step_sankey(path_pattern="payment_details->.*->shipping_details->.*->purchase", step_window=2)Path pattern - drop-off points
path_pattern="path_end" centers on where paths end, so the columns to the left show
what users tend to do right before dropping off (or completing their path).
stream.step_sankey(path_pattern="path_end")Diff mode
stream.step_sankey(diff=["platform", "mobile", "desktop"])Parameters
Data
Data parameters change the computed result. They are exactly the arguments of
the widget's headless twin stream.step_sankey_data() — see
headless mode below.
| Parameter | Type | Description |
|---|---|---|
max_steps | int, default 10 | Number of path steps to compute. |
anchor | str or dict, optional | Centre on one position instead of laying out a pattern's parts; an anchor spec, same form as truncate_paths' start_anchor. Yields a single block and is mutually exclusive with path_pattern. See step_sankey_data. |
diff | tuple or list, optional | Draws a comparative chart for a pair of segments; see Diff mode. (segment_col, value1, value2) or (path_ids1, path_ids2); value2 may be <REST>. |
path_col | str, optional | Path ID column override; defaults to schema.path_col. |
path_pattern | str, optional | Same syntax as step_matrix's path_pattern. |
Display
Display parameters only affect how the widget is rendered.
| Parameter | Type | Description |
|---|---|---|
step_window | int, default 3 | Number of step columns shown around each anchor. Only slices what max_steps computed, so a window wider than that — set here or in the sidebar — raises max_steps to step_window + 10 and recomputes. |
height | int, default 500 | Widget height in pixels. |
sidebar_open | bool, default True | Whether the sidebar starts open. |
state_file | str, optional | JSON file the widget state is bound to; see Saving widget state. |
Headless mode
stream.step_sankey_data()
Compute per-step event-share matrices for Step Matrix / Step Sankey (headless).
Both widgets render the same underlying data — Step Matrix as a heatmap, Step Sankey as a flow diagram.