Step Matrix
Heatmap of what users are doing at each step of their path: cell
[event, step] is the share of paths on that event at that step, so every
column sums to 1 (to 0 in diff mode). Rows are events, columns are steps
from the anchor — path_start by default, or a path_pattern event, in
which case the columns to its left are negative.
Same numbers as Step Sankey, drawn as a table.
How it works
Stack every path up, slice the stack by step, and count: what share of paths is sitting on each event at step 1, at step 2, and so on? That table is the Step Matrix — one of the three aggregated representations of trajectories described in Path Analysis.
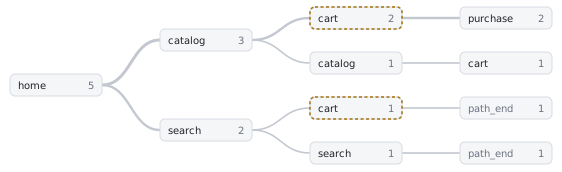
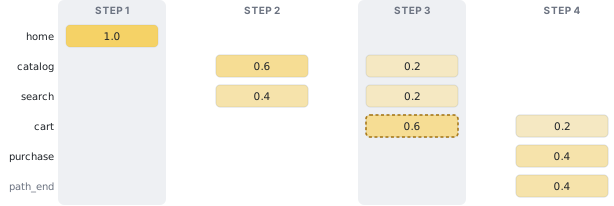
Reading it:
- A cell is a share of paths, not of events. Row
cart, column 3 = 0.6 means 60% of all paths hadcartas their third event. - Every column sums to 1 (in diff mode, to 0), because every path is
somewhere at every step. Paths that have ended sit in
path_end, which is why that row fills up towards the right. - Branches merge. Two groups of users reaching
cartat step 3 by different routes land in the same cell. The matrix tells you what happens at each step, not which route got there.
Step Matrix and Step Sankey are two renderings of exactly the same numbers — they share one headless method. The matrix is easier for reading a single event across steps and for spotting rare events; the Sankey is easier for following volume.
Anchoring on an event
By default step 1 is each path's own first event. path_pattern re-anchors the
matrix on an event instead: every path is shifted until that event sits in
column 0, and the steps before it get negative numbers.
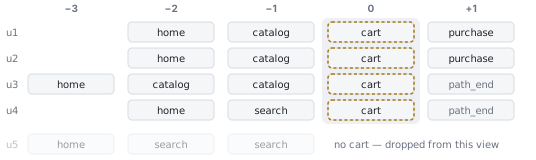
Column −1 then answers "what leads into this event?" and column +1 "what follows it?" — questions the start-anchored view smears across many columns whenever the event happens at different steps for different users.
A pattern with several anchors ("add_to_cart->.*->purchase", where .* matches
any run of events) draws one block of columns per anchor, side by side, so you
can walk a funnel and still see each step's neighbourhood. When a block's edge
isn't a real path boundary the widget draws it serrated, signalling that paths
continue beyond the visible range.
Usage
stream.step_matrix(path_pattern="purchase")
stream.step_matrix(path_pattern="add_to_cart->.*->purchase")
stream.step_matrix(diff=("user_lifecycle", "new", "loyal"))
Examples
Basic
Without a path_pattern, the matrix is anchored at path_start: column 0 is the first
step of every path, and each column to the right is one step further in.
stream.step_matrix()Path pattern - central event
A single event as path_pattern re-centers the matrix on that event instead of
path_start: column 0 is always purchase, negative columns are the steps leading up
to it, positive columns are what follows.
stream.step_matrix(path_pattern="purchase")Path pattern - funnel patterns
Chaining several anchors with .* renders one matrix block per anchor, side by side,
so you can follow a multi-step funnel across blocks.
stream.step_matrix(path_pattern="payment_details->.*->shipping_details->.*->purchase", step_window=2)Path pattern - drop-off points
path_pattern="path_end" centers on where paths end, so the columns to the left show
what users tend to do right before dropping off (or completing their path).
stream.step_matrix(path_pattern="path_end")Anchor - which occurrence, and offsets
path_pattern lays a pattern's parts out side by side, one block each, and always
centers on the first match. anchor centers on one position instead, and takes the
same spec as truncate_paths' start_anchor — so it reaches the two things a pattern
cannot say: which occurrence, and an offset in events or in time.
stream.step_matrix(anchor={"pattern": "cart", "occurrence": "last"})The two are mutually exclusive. A path where the anchor does not resolve has no center,
so it is not in the matrix — the anchor selects as well as centers. occurrence="all"
is rejected here: several centers per path would let one path count more than once,
while every cell is a share of paths.
Diff mode
Passing diff splits paths into two segments and shows the difference between them at
each step, making it easy to spot where the segments' behavior diverges.
stream.step_matrix(diff=["platform", "mobile", "desktop"])Parameters
Data
Data parameters change the computed result. They are exactly the arguments of
the widget's headless twin stream.step_matrix_data() — see
headless mode below.
| Parameter | Type | Description |
|---|---|---|
max_steps | int, default 10 | Number of path steps to compute on each side of the anchor. |
diff | tuple or list, optional | Draws a comparative chart for a pair of segments; see Diff mode. (segment_col, value1, value2) or (path_ids1, path_ids2); value2 may be <REST>. |
path_col | str, optional | Path ID column override; defaults to schema.path_col. |
path_pattern | str, optional | Restrict and split paths on a "->"-separated event sequence: "add_to_cart->.*->purchase" is those two in that order with anything in between, "add_to_cart->[^support_chat]*->purchase" the same without support in between. Full syntax: Path Patterns. Without a pattern, shows the whole path from path_start to path_end. Multiple anchors render one matrix block per anchor, side by side. A pattern that doesn't start at path_start or end at path_end shows a serrated edge, signalling paths continue beyond the visible range. To see the neighborhood around a single event: path_pattern="add_to_cart". |
anchor | str or dict, optional | Centre on one position instead of laying out a pattern's parts; an anchor spec, same form as truncate_paths' start_anchor. Yields a single block and is mutually exclusive with path_pattern. See step_sankey_data. |
Display
Display parameters only affect how the widget is rendered.
| Parameter | Type | Description |
|---|---|---|
step_window | int, default 3 | Number of step columns shown around each anchor. Only slices what max_steps computed, so a window wider than that — set here or in the sidebar — raises max_steps to step_window + 10 and recomputes. |
height | int, default 600 | Widget height in pixels. |
sidebar_open | bool, default True | Whether the sidebar starts open. |
state_file | str, optional | JSON file the widget state is bound to; see Saving widget state. |
Headless mode
stream.step_matrix_data()
Alias for step_sankey_data — Step Matrix and Step Sankey render the
same underlying per-step data, so both widgets share one headless method.